Short Description
Protocol measuring the cellular internalisation rate of chlamydia based on two fluorescence reporters (one for all bacteria, one for extracellular bacteria)
Citation: Vromman F, Laverrière M, Perrinet S, Dufour A, Subtil A (2014) Quantitative Monitoring of the Chlamydia trachomatis Developmental Cycle Using GFP-Expressing Bacteria, Microscopy and Flow Cytometry. PLoS ONE 9(6): e99197.: https://doi.org/10.1371/journal.pone.0099197Documentation
Description
This protocol was developed to calculate the internalisation rate of chlamydia trachomatis within cells using two fluorescent reporters. One of the reporter tags all bacteria, while a second reporter tags only the extracellular bacteria. The bacteria are detected using a spot detection module applied to both fluorescent reporters, and the internalisation rate is given as a ratio of the number of intracellular bacteria and the total number of detected bacteria (the number of intracellular bacteria is inferred by subtracting the number of detected extracellular bacteria to the total number of detected bacteria).
How to download and use this protocol
- Type “ChlamEntry” within the Icy search bar and click on this protocol to download and open it.
- Load the raw fluorescent (multi-channel) image into Icy
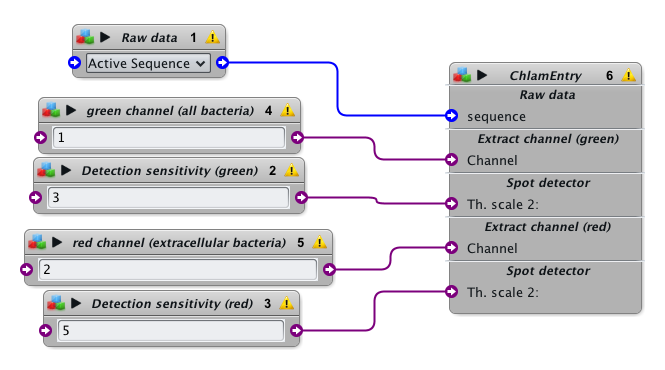
- Select the image in block 1 (Raw data), or leave it to “Active Sequence” to select the last focused inage
- Indicate the channel where all bacteria are tagged (block 4)
- Indicate the detection sensitivity for this channel
- Indicate the channel where extracellular bacteria are tagged (block 5)
- Indicate the detection sensitivity for this channel
- Click on the general “Run” button in the protocols interface
Results
This protocol produces 3 results files, all located next to the original image on disk (make sure Icy has write-access to said disk):
- A file called “your-image-name.coloc.txt” indicating the total number of detected bacteria, the number or extracellular bacteria, and the inferred number of intracellular bacteria alongside the corresponding internalisation rate (%)
- A file called “your-image-name_result.tiff” containing a screenshot of the analysis (for visual control), where: a) all detected bacteria are surrounded by a red circle; b) all extracellular bacteria are surrounded by a green circle; and c) all the bacteria considered as “double tagged” (so technically, all extracellular bacteria, but your mileage may vary due to staining artifacts) will display a white bar joining the green and red circles. Important note: bacteria are considered “double tagged” if the corresponding green and red circles are up to 4 pixels apart (this parameter can be changed if necessary by expanding the “ChlamEntry” block and adjusting the “Max distance” value in block 11 aka “Colocialize green and red bact”)
- A file called “results.txt” containing the name of the processed image alongside the final internalisation rate as measured above (%). Note that if this file already exists, a new line is added to the end (convenient if you mostly care about the final statistics on multiple files)
Licensing & Reference
You are free to re-use, modify, extend, and re-publish this protocol, provided you acknowledge and cite the associated publication:
Vromman F, Laverrière M, Perrinet S, Dufour A, Subtil A (2014) Quantitative Monitoring of the Chlamydia trachomatis Developmental Cycle Using GFP-Expressing Bacteria, Microscopy and Flow Cytometry. PLoS ONE 9(6): e99197. https://doi.org/10.1371/journal.pone.0099197