Short Description
Measures the SNR, Contrast Index (CI), Normalized Contrast Index (NCI) and Contrasted Imaging Volume (CIV) on the extracted sub-volume of light sheet images of tissue mimics.
Related protocols: P1 – Detect tissue mimics and crop 3D sub-volume and P3 – Characterize the PSF from beads in 3D. Related plugin: metroloSPIM. Tissue-mimics example datasets to test the plugin and protocols are available on Zenodo.
Team: R&D ImagerieInstitution: RESTORE-GOT IT Team UMR 5070-CNRS 1301-INSERM EFS Univ. Toulouse, France
Website: https://www.itav.fr/plateformes-technologiques/R-et-D-imagerie/Team: SLN - Team Loza
Institution: ICFO-Institut de Ciences Fotonique, Av. Carl Friedrich Gauss, 3, Castelldefels, 08860, Barcelona, Spain
Website: https://www.icfo.eu/lang/research/groups/groups-details?group_id=16Citation: https://doi.org/10.1038/srep44939
Documentation
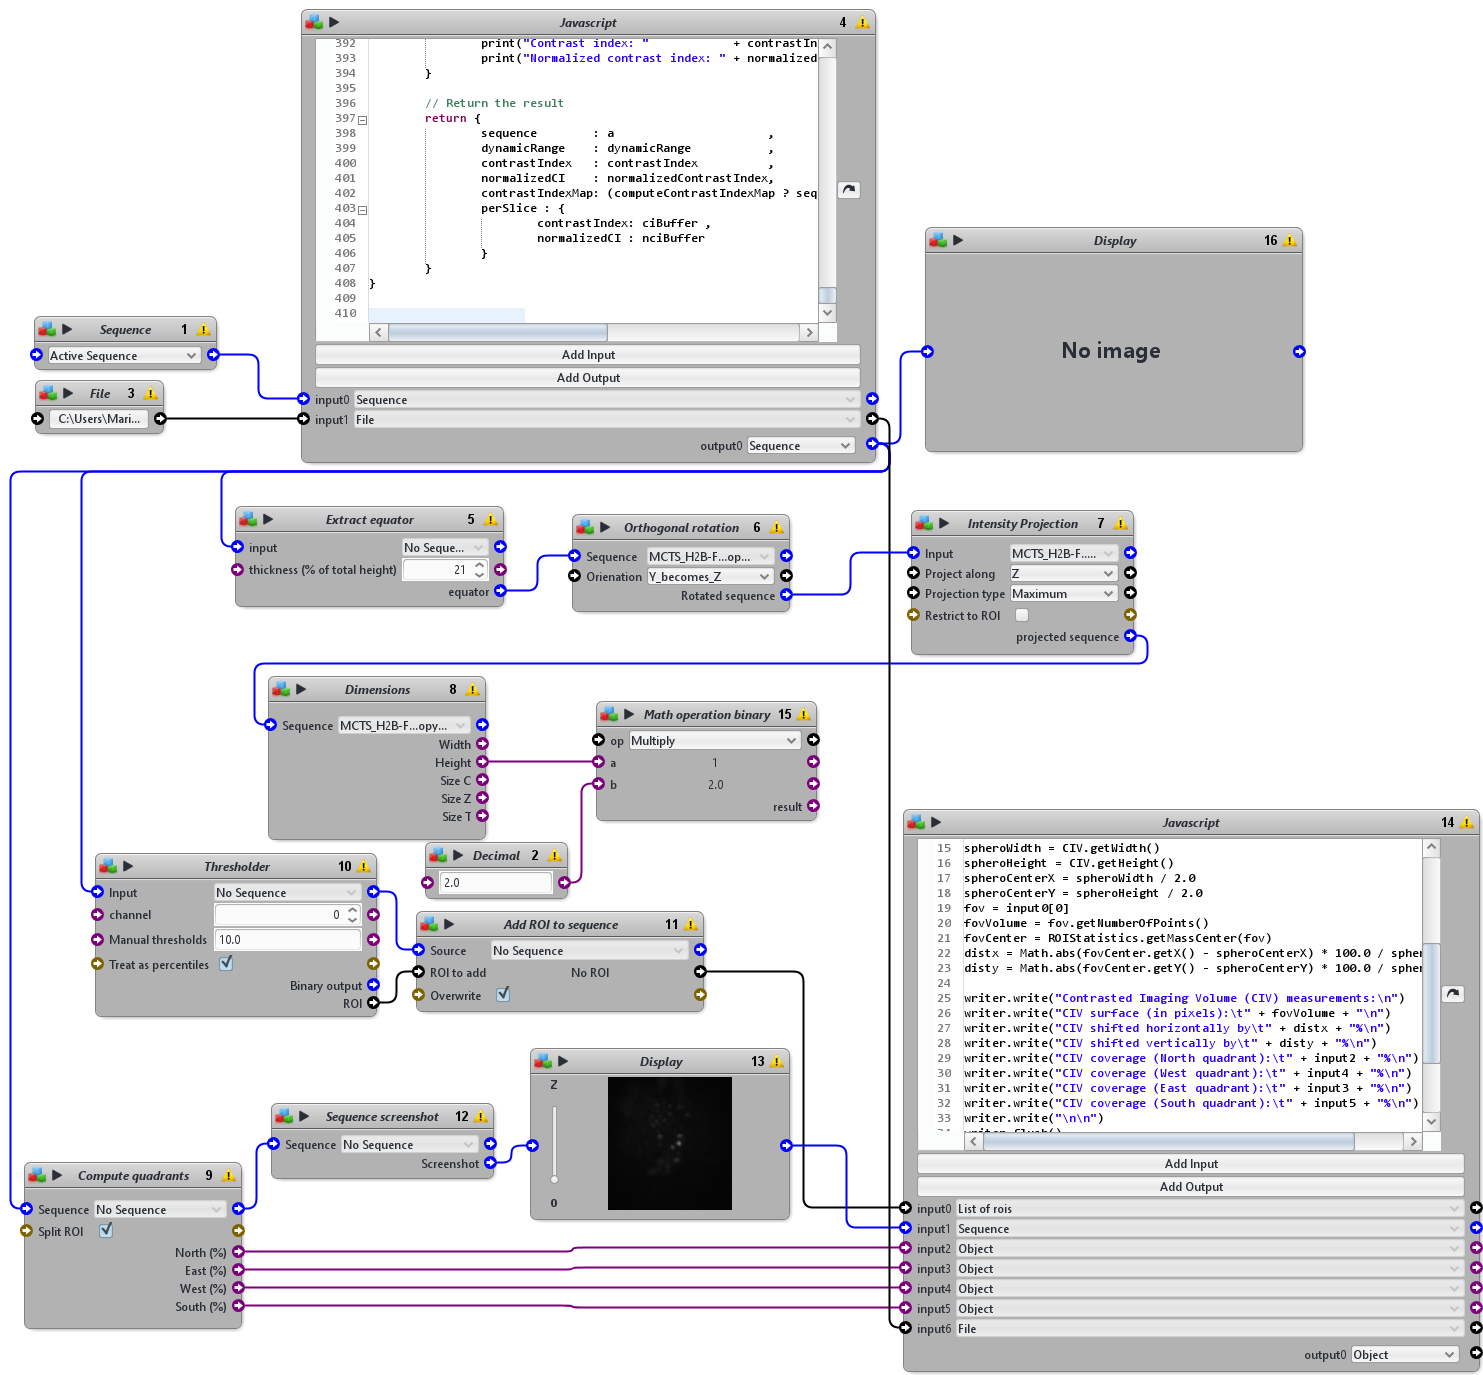
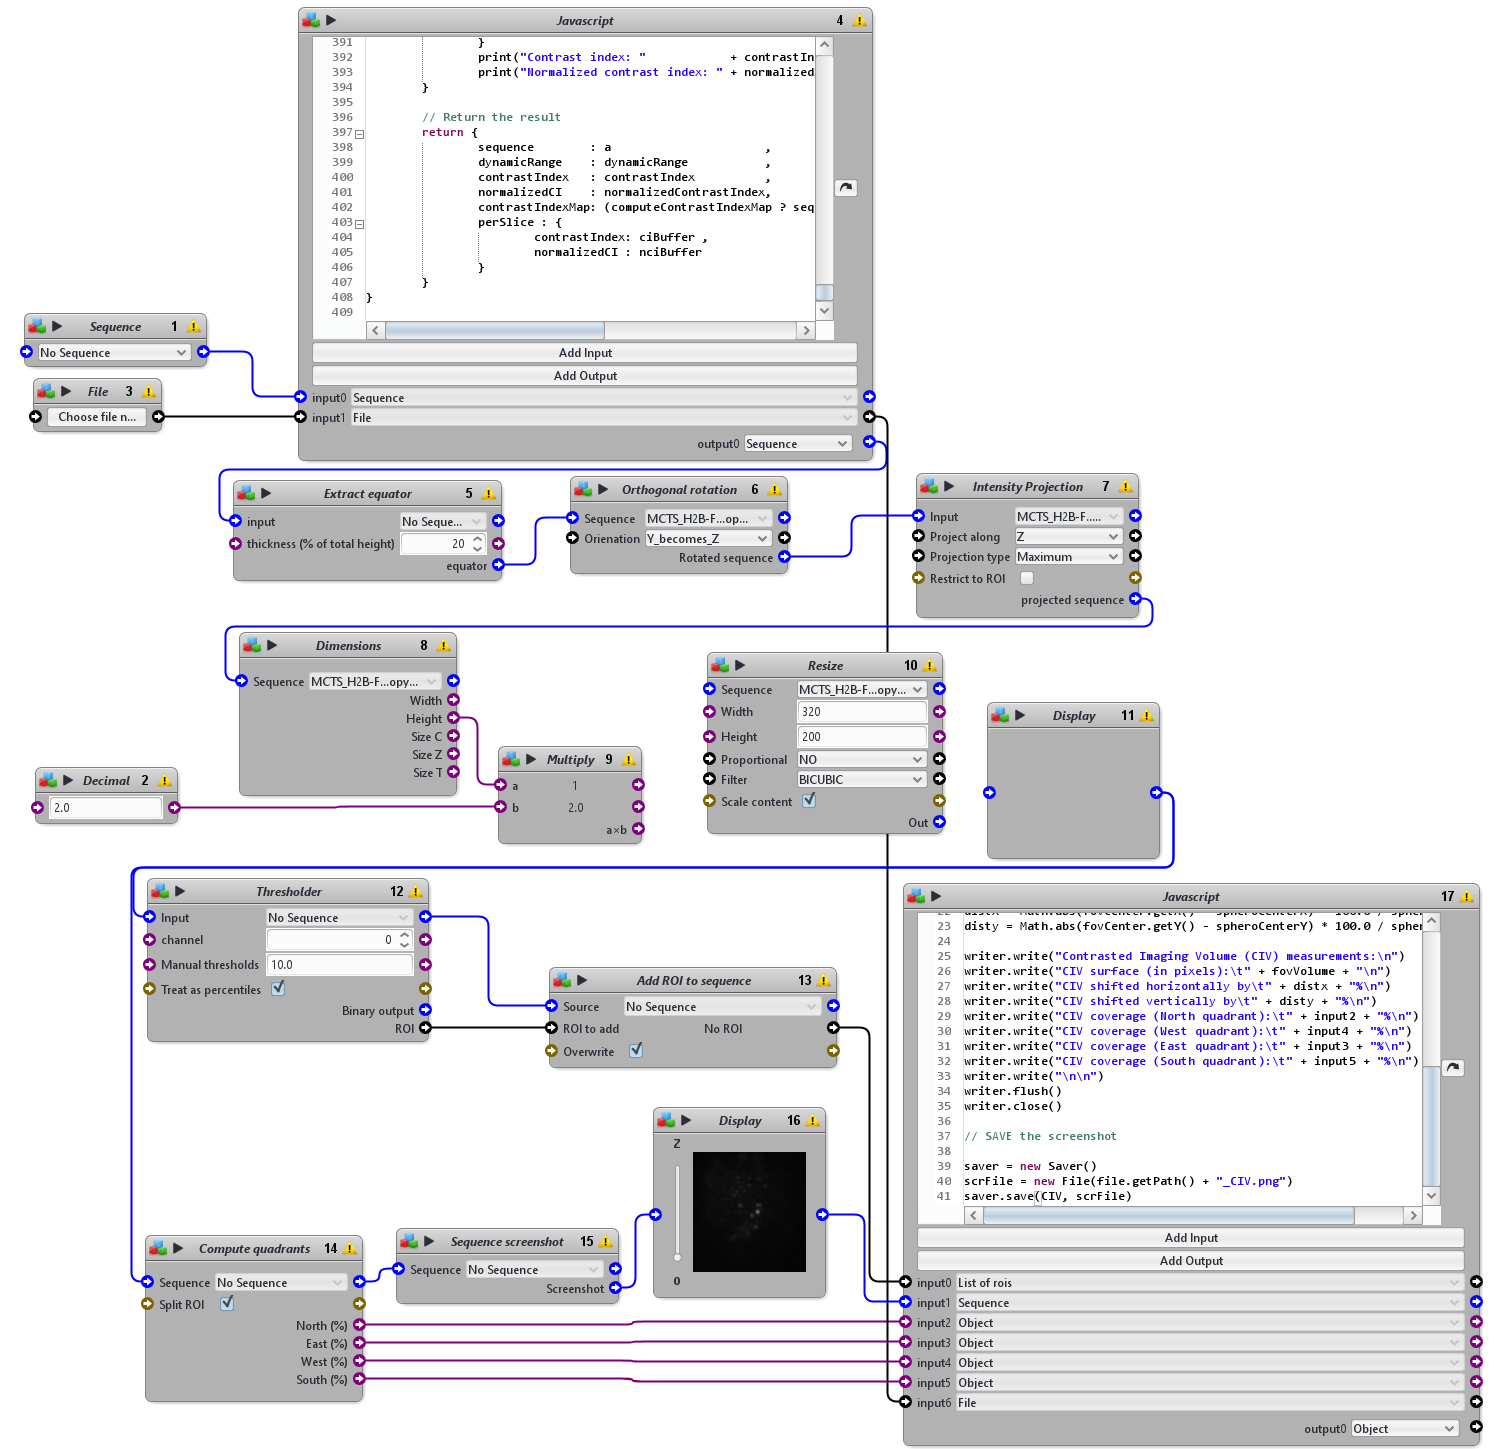
This protocol was designed to automatically measures the SNR, Contrast Index (CI), Normalized Contrast Index (NCI) and Contrasted Imaging Volume (CIV) on the extracted sub-volume of light sheet images of tissue mimics (TM).
NB: This protocol takes as input a 3D sequence, for instance cropped with P1 protocol, and the name of the dataset. It outputs a text file with the name of the dataset containing SNR, CI and CIV measurements and screenshot images slice by slice of the original image with the quadrant layer superposed on top. Large sequences may take a long time to process, prefer cropped sequences.
The information below regarding the calculation of the SNR, CI and CIV come from the Supplementary Note 3: Image analysis framework of Andilla et al. 2017.
The SNR is obtained as a ratio between the dynamic range of sequence, which measures the gap between the brightest objects and the darkest areas in a 3D image in terms of intensity, and the standard deviation of the noise present in the 3D image. These two quantities are evaluated as follows:
– The dynamic range is obtained as the difference between the 99.5% and the 0.1% quantiles of the voxel intensities. Compared to the approach that defines the dynamic range as the difference between the maximum and the minimum of the voxel intensities, our quantile-based method is more robust with respect to the presence of erroneous voxel intensity measurements.
– The method proposed to evaluate the standard deviation of the noise follows anapproach proposed by Starck & Bijaoui, Image processing and data analysis. Cambridge University Press (1998), which consists of (i) computing a low-pass filtered version of the 3D image by applying an isotropic Gaussian kernel with a standard deviation parameter set at 1.5 pixels, (ii) subtracting this low-pass filtered 3D image from the original one to extract its high-frequency content,which corresponds mostly to noisy data. The standard deviation of this residual is then evaluated through a rank estimator. It is important to note that the low-pass filtered version of the 3D image involved in this computation should not beunderstood as a denoised version of the input: in particular, the Gaussian kernelmay introduce significant artifacts close to the object edges in the image. However, in homogeneous areas, the Gaussian kernel is efficient in separating thenoise from the signal of interest.With this definition, the SNR measure is invariant with respect to linear contrast transformations.
The CI is measured using a 3D contrast map representing the local intensity variance computed for each voxel. To define the contrast index, we first built a contrast index map, which evaluates the local contrast in the vicinity of each voxel of the 3D image. More precisely, the value of the contrast index map at a given voxel X is defined as the standard deviation of the voxel intensities in a Gaussian window shaped with a standard deviation parameter setat 1.5 pixels. All the local contrast measures are then aggregated intoa global index, by taking the square root of the mean of the square of the contrast index map. This approach follows the one proposed in Wang & Bovik, “Mean squared error: Love it or leave it? A new look at Signal Fidelity Measures,” in IEEE Signal Processing Magazine, 2009 to characterize image contrast information. With this definition, the contrast index is not invariant with respect to linear contrast transformations. We therefore define a normalized version of the contrast index NCI, that is: the normalized contrast index is obtained as the ratio between the contrast index and the dynamic range measure introduced in relation to SNR evaluation.
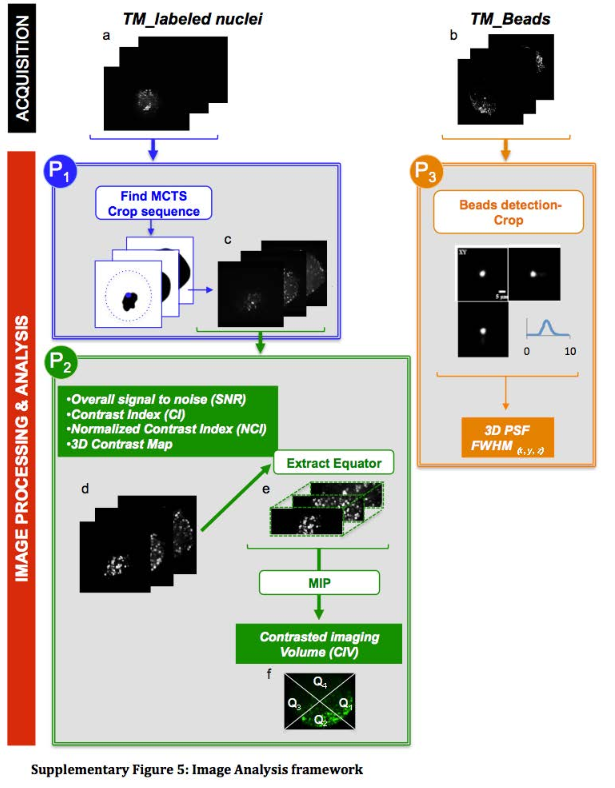
To determine CIV, xz cross-sectional images are used as an indication of the apparent penetration depth of the imaging systems. The CIV is then estimated in 3 steps: (i) the equator volume of the TM is extracted from the 3D contrast map coplanar with both illumination and imaging axes, with a thickness equaling 20% of the TM; (ii) The extracted volume is projected into a 2D image using Maximum Intensity Projection (MIP); (iii) Finally, quadrants are delineated on the MIP, and the percentage of area displaying more than 5-20% of local contrast in each quadrant is measured.
Please cite Andilla et al. 2017 if you re-use this protocol or make a modified version of it. Figure below comes from the supplementals of Andilla et al., 2017. The protocol described here is the protocol P2. The protocol P1 detects tissue mimics imaged with a light-sheet microscope and crops 3D sub-volume and should be used prior to P2.


