Short Description
Spots detection and colocalisation analysis with SODA
Institution: Institut Pasteur
Website:
Documentation
Please cite as: Louveaux, Marion. (2020, July 1). Spots detection and colocalisation analysis with SODA (Version 1.0). Zenodo. http://doi.org/10.5281/zenodo.3925192
Test image available at doi: 10.5281/zenodo.3925213 (choose the Jurkat cell example).
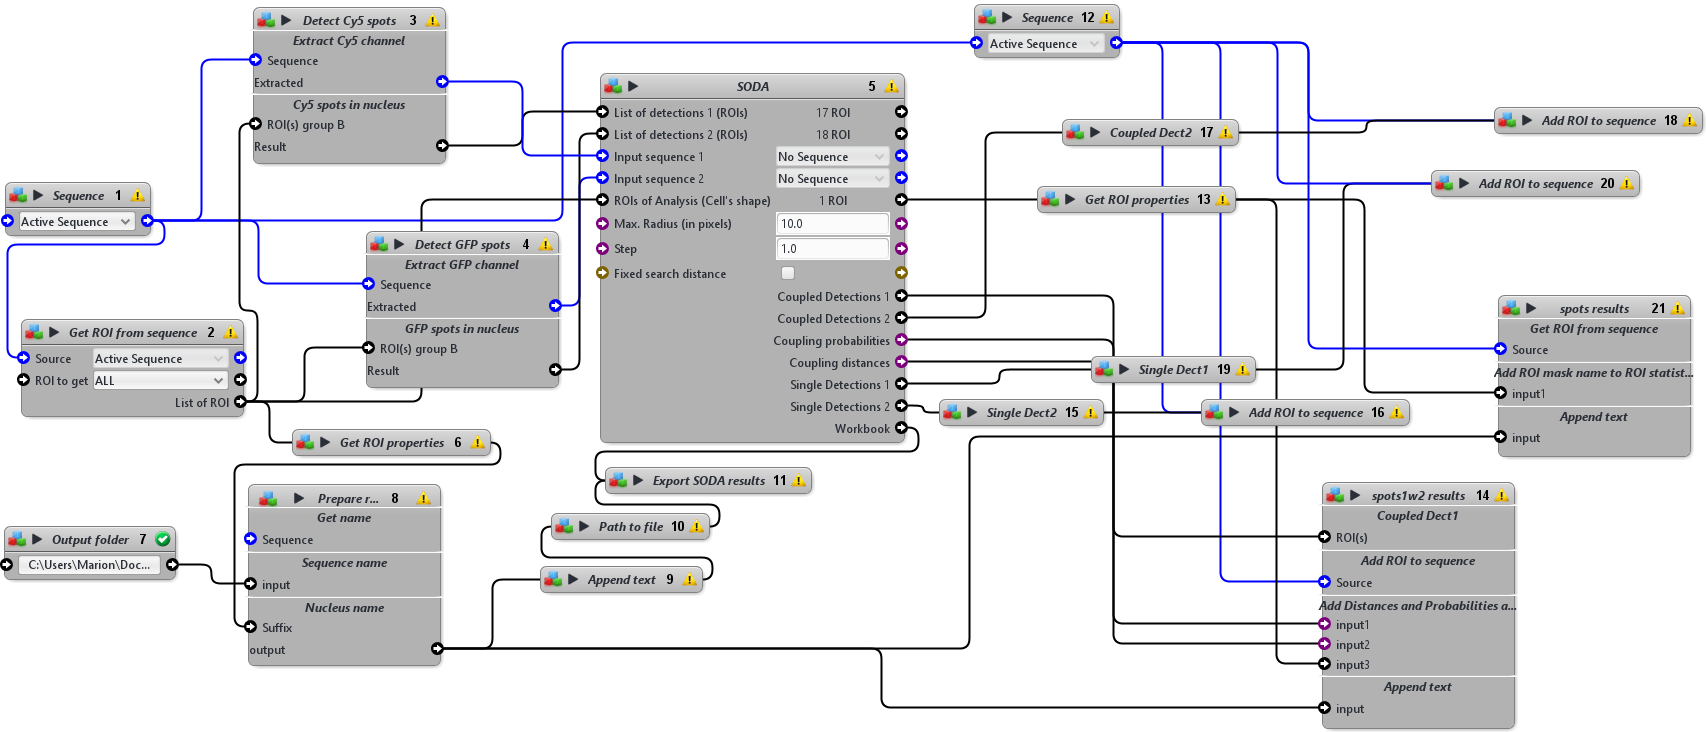
This protocol detects two categories of spots (Cy5 fluorescent spots and EGFP fluorescent spots in the example image) and analyse their colocalisation using SODA on a 2D input sequence with a ROI mask (nucleus, since spots are located inside the nuclei). The input sequence should be opened and active. In the Output folder block, provide the path to the results folder, where Excel spreadsheets containing SODA results should be saved.
Cy5 spots were detected with the HK Means block (Dufour et al. (2008)). The logical operation block was used to keep only the spots detected in the nucleus. These spots were added as input parameter “List detection 1” of the SODA block.
EGFP spots were detected using the log3D block to enhance the spots, inverting the log transformed image using the Math Operation Expression block with the following expression: A*B with A scalar=-1 and B the log transformed image, detecting the spots with the Local Extrema block and segmenting the spots with a dilation and a connected components operations. The logical operation block was used to keep only the spots detected in the nucleus. These spots were added as input parameter “List detection 2” of the SODA block. The nucleus ROI was kept as input parameter for “ROI of Analysis (Cell’s shape)”. The Cy5 and GFP spots ROIs were then imported in the SODA block (Lagache et al. (2018)) to analyse colocalisation of spots within the nucleus only with a maximum radius of 10, a step of 1 and no fixed search distance. Numerical data were exported as an Excel spreadsheet and for each analysed nucleus, spots ROIs were colored according to the results of the colocalisation study: green or red if not coupled, white or purple if coupled.