Short Description
- computes ROI measurements. Measures include geometric (bounding box) and intensity information
- updates measurements live when ROIs are modified
- exports the measures to 3rd-party sheet edition softwares.
For 3D measurements, you could be interested as well by the 3D Analysis plugin.
Institution: Institut Pasteur
Website: https://research.pasteur.fr/en/team/bioimage-analysis/
Documentation
This plugin computes measurements (also called descriptors or features) on the Regions Of Interest (ROI), and exports these measures to a text or spreadsheet file.
It currently has three working modes:
- Standalone interface
- As a tab called “ROI tab” in the side pane on the right of the GUI of Icy
- As Protocols block
Data can be saved 2 formats:
- Spreadsheet: produces a “.xlsx” file, compatible with most spreadsheet software. For the ROI color descriptor, the color of the ROI is used to fill the background of the cell and the cell is filled with the hexadecimal code (see ROI blocks for more info on the ROI color). Note that the stored color may differ slightly from the actual ROI color, due to XLS format restrictions on color palettes.
- Text: produces a “.txt” file, where each cell is delimited with a tabulation character (“t”). Preferred format to process further the data with R or Python programming languages. Note that the name of each sheet is inserted inside the text file before the actual sheet contents, with beginning and ending “==” symbol (e.g. “== ROI Statistics ==”).
We detail below the specificities of each mode and give the definition of each descriptor.
Standalone interface
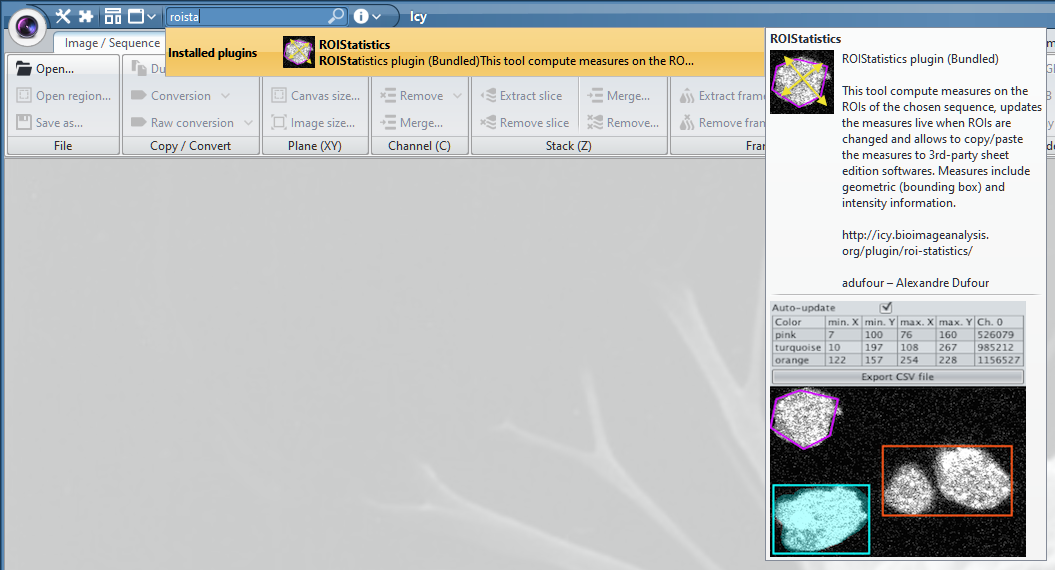
Type “roistatistics” in the search bar of Icy to access it.
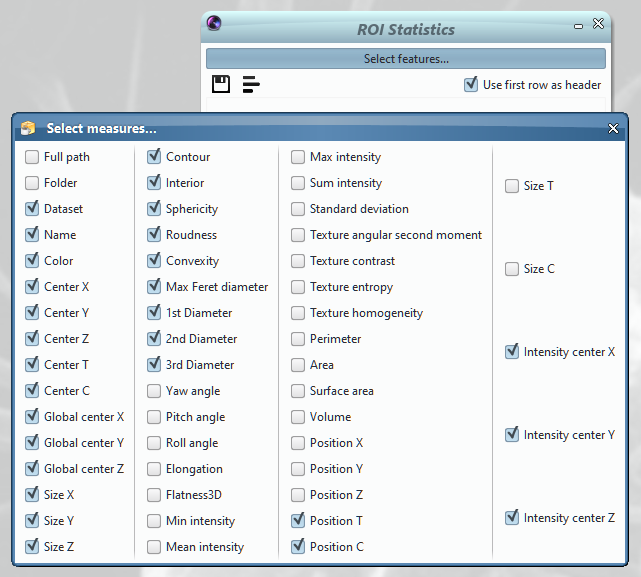
- To compute measurements on ROIs, click on “Select features…” and tick the measurements you would like to compute.
- To save the measurements, click on the floppy disk and select “Export as text file” or “Export as Excel file”, this open a dialog box with which you can indicate the path to save the data (folder and name of the file). Note that the plugin generates a spreadsheet view with one sheet per opened image.
- To make plots, click on the three stacked lines next to the floppy disk to display histograms or scatterplots of the measurements.
ROI tab
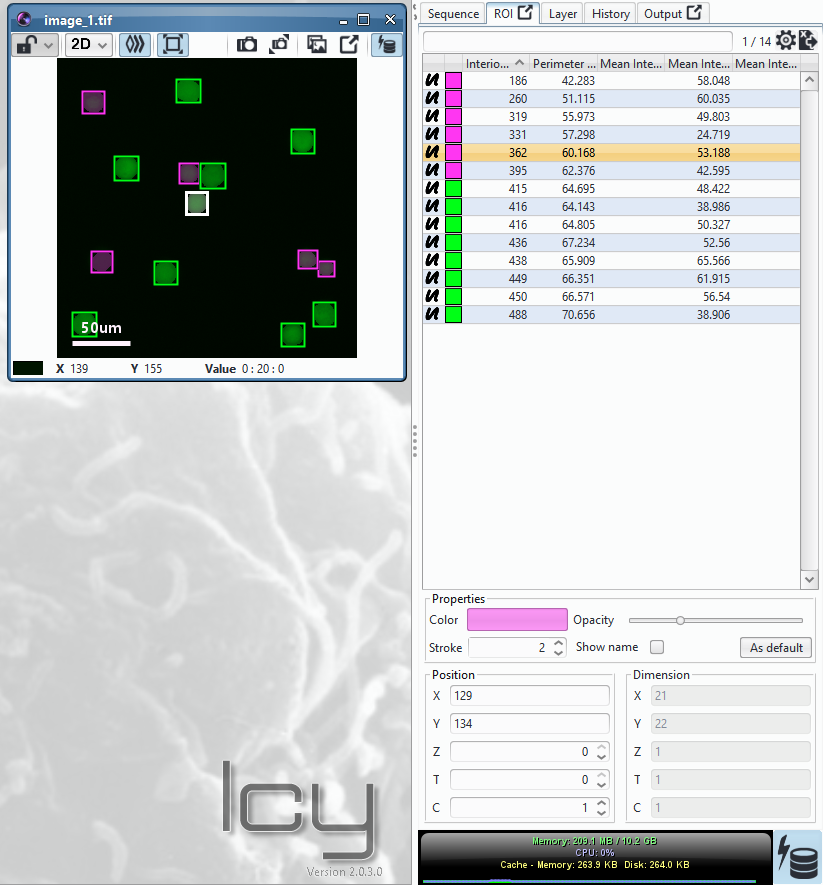
The ROI tab is located in the side pane on the right side of the graphical user interface (GUI) or Icy. It automatically stores measurements from ROIs. Click on the spreasheet with an arrow to export the measurements. Click on the wheel to choose the measurements to display in the tab and the ones to export.
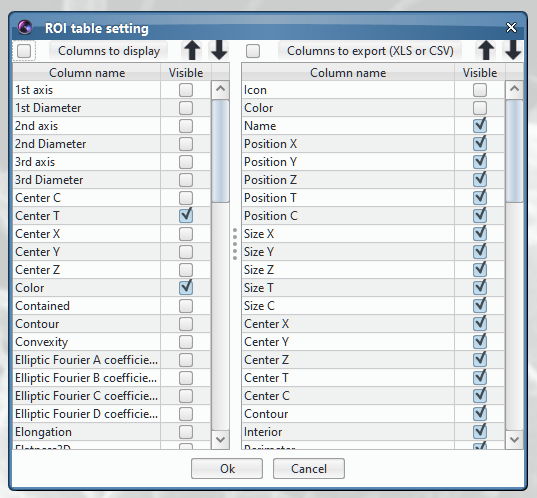
Clicking on the wheel displays two tables:
- on the right: what is displayed in the tab
- on the left: what is exported (in .txt or .xls)
Tick the box on the upper left corner to tick/untick all descriptors. Click on “Columns to display” to re-order unticked descriptors. Move a descriptor up or down the list: click on the name of the descriptor to select it, then click on the arrows in the upper right corner.
Protocols block
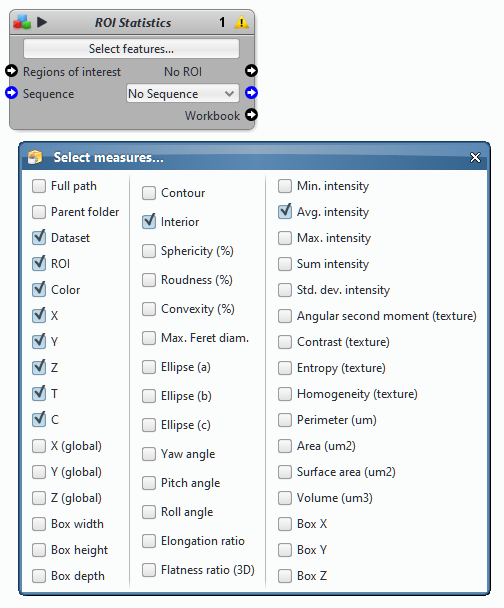
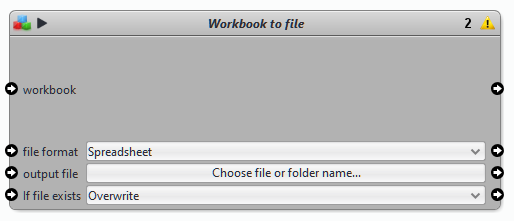
The block generates a spreadsheet with a single sheet or “workbook” named “ROI Statistics”. The spreadsheet can be saved to disk using the “Workbook to file” block with the following options:
- format: “Spreadsheet” or “Text” to export the data to .xlsx (Spreadsheet file format) or .tsv (Text file format)
- output file: opens a dialog box, in which you need to provide the full path to save the data (including the file name)
- merge: if file exists “Overwrite” (to replace the file), “Merge sheets” (to merge files when processing files in batch), or “Merge sheets excluding first row” (also to merge files but without repeating the first row, which usually contains the name of the columns)
Available descriptors
| Name | Definition |
| 1st axis (um) | The 3D coordinates of the first principal axis of the ROI shape. Perpendicular to both the second and third principal axes. |
| 1st Diameter (um) | The diameter (along each axis) of the best fitting ellipse (or ellipsoid), expressed in pixels. |
| 2nd axis (um) | The 3D coordinates of the second principal axis of the ROI shape. Perpendicular to both the first and third principal axes. |
| 2nd Diameter (um) | The diameter (along each axis) of the best fitting ellipse (or ellipsoid), expressed in pixels. |
| 3rd axis (um) | The 3D coordinates of the third principal axis of the ROI shape. Perpendicular to both the first and second principal axes. |
| 3rd Diameter (um) | The diameter (along each axis) of the best fitting ellipse (or ellipsoid), expressed in pixels. |
| Angle (°) | Visible only when plugin Angle Descriptor is installed and a polyline with 3 points is drawn. Angle between the 3 points. |
| Area (um2) | Area given in real units computed from the pixel size information from the image. |
| Center C | The coordinates (in pixels) of the center of mass of the ROI along each axis. |
| Center T | The coordinates (in pixels) of the center of mass of the ROI along each axis. |
| Center X | The coordinates (in pixels) of the center of mass of the ROI along each axis. |
| Center Y | The coordinates (in pixels) of the center of mass of the ROI along each axis. |
| Center Z | The coordinates (in pixels) of the center of mass of the ROI along each axis. |
| Color | ROI color, with hexadecimal code, see the documentation on ROI blocks for more information on the hexadecimal color coding in Icy. |
| Contained | The amount of ROIs that are completely inside the current ROI. If an ROI is partially inside the current ROI, it is not counted (use Intersected instead). |
| Contour (px) | The perimeter (in 2D) or surface area (in 3D), expressed in pixels. |
| Convexity (%) | The ratio between the volume and the volume of the smallest convex envelope containing the ROI, expressed as a percentage (100% for a convex object). |
| Dataset | The name of the dataset (typically the name of the image or sequence) (plugin and block only). |
| Elongation | A scale factor given by the ratio between the first and second ellipse diameters (see above). The minimum value is 1 (for a non-elongated object). |
| Flatness3D | 3D only, a scale factor given by the ratio between the second and third diameters (see above). The minimum value is 1 (for an object with perfectly circular section perpendicularly to the major axis). |
| Folder | The name of the folder containing the image file (plugin and block only). |
| Full path | The full path of the folder containing the image file (plugin and block only). |
| Global center X (px) | The coordinates (in microns) of the center of mass of the ROI along X on the sequence, taking into account the pixel size and the sequence position (plugin and block only). |
| Global center Y (px) | The coordinates (in microns) of the center of mass of the ROI along Y on the sequence, taking into account the pixel size and the sequence position (plugin and block only). |
| Global center Z (px) | The coordinates (in microns) of the center of mass of the ROI along Z on the sequence, taking into account the pixel size and the sequence position (plugin and block only). |
| Icon | Image of the ROI type. |
| Id | Internal identifier for the current ROI. WARNING: This identifier is not stable as it changes with each instance of Icy. It’s just for internal use only. |
| Intensity center X (px) (ch0) | Mean intensity-weighted x position of the ROI. |
| Intensity center Y (px) (ch0) | Mean intensity-weighted y position of the ROI. |
| Intensity center Z (px) (ch0) | Mean intensity-weighted z position of the ROI. |
| Interior (px) | The area (in 2D) or volume (in 3D), expressed in pixels. |
| Intersected | The amount of ROIs intersecting the current ROI. Contrary to the Contained descriptor, partially contained ROIs are counted with this descriptor. |
| Max Feret diameter (um) | The maximum distance between any 2 points of the surface. |
| Max Intensity (ch 0) | Maximum intensity. |
| Mean Intensity (ch 0) | Average intensity. |
| Min Intensity (ch 0) | Minimum intensity. |
| Name | The name of the region of interest (this can be changed from the “ROI” panel in the Inspector window), by default ROIs are called according to their shape, for instance “Polygon2D”. |
| Opacity | The opacity level of the ROI. A value of one means no transparency, a value of zero means that the ROI is completely transparent |
| Perimeter (um) | Perimeter given in real units computed from the pixel size information from the image. |
| Pitch (°) | The counter-clockwise angle of the object main axis on the x-z plane (around the y+ axis). Equal to 0 when aligned with the x-y plane, the sign follows the z axis. See https://en.wikipedia.org/wiki/Ship_motions |
| Position C | The position of the upper left corner of the bounding box around the ROI along each axis (x, y, z, frame and channel). |
| Position T | The position of the upper left corner of the bounding box around the ROI along each axis (x, y, z, frame and channel). |
| Position X | The position of the upper left corner of the bounding box around the ROI along each axis (x, y, z, frame and channel). |
| Position Y | The position of the upper left corner of the bounding box around the ROI along each axis (x, y, z, frame and channel). |
| Position Z | The position of the upper left corner of the bounding box around the ROI along each axis (x, y, z, frame and channel). |
| Read Only | The edition state of the ROI. True means no changes can be made to the ROI. False means the ROI can be modified (shape and color modifications). |
| Roll (°) | The counter-clockwise angle around the object principal axis. See (https://en.wikipedia.org/wiki/Ship_motions) |
| Roundness (%) | Following the ISO 1101 standard: the normalised ratio between the radius of the minimum inscribed and largest cicrcumbscribed circles (or spheres), expressed as a percentage (100% for a circle or sphere). |
| Size C | The size (in pixels) of the bounding box around the ROI along each axis (width, height, depth, number of frames and channels). |
| Size T | The size (in pixels) of the bounding box around the ROI along each axis (width, height, depth, number of frames and channels). |
| Size X | The size (in pixels) of the bounding box around the ROI along each axis (width, height, depth, number of frames and channels). |
| Size Y | The size (in pixels) of the bounding box around the ROI along each axis (width, height, depth, number of frames and channels). |
| Size Z | The size (in pixels) of the bounding box around the ROI along each axis (width, height, depth, number of frames and channels). |
| Sphericity | As defined by H. Wadell in 1935: The normalised ratio between the contour and interior, expressed as a percentage (100% for a circle or sphere). |
| Standard Deviation (ch 0) | Standard deviation of the intensity distribution for each channel inside the ROI. |
| Sum Intensity (ch 0) | Sum of the intensity distribution for each channel inside the ROI. |
| Surface Area (um2) | 3D only, the surface of the element, generally using the contour pixels. |
| Texture angular second moment (ch 0) | Energy, also called “Angular Second Moment” or “Uniformity” is a measure of textural Uniformity of an image. Energy reaches its highest value when grey level distribution has either a constant or a periodic form. An homogenous image contains very few dominant grey tone transitions. Therefore the GLCM (Gray level co-occurrence matrix) for this image will have fewer entries of larger magnitude resulting in large value for energy feature. In contrast, if the GLCM contains a large number of small entries, the energy feature will have a smaller value. |
| Texture contrast (ch 0) | Measure of the local (neighboring) gray level variations. Computed using a gray-level co-occurrence matrix |
| Texture entropy (ch 0) | Entropy measures the disorder of an image. it reaches its smallest value when all elements in the image are equal. When the image is not texturally uniform, many GLCM (Gray-level co-occurrence matrix) elements have very small values, which imply that entropy is very large. Therefore, entropy is inversely proportional to GLCM energy. |
| Texture homogeneity (ch 0) | It can be described as an inverse to the contrast of an image: only entries close to the diagonal of the GLCM (Gray-level co-occurrence matrix) have a big impact on the homogeneity value. |
| Volume (um3) | 3D only, volume given in real units computed from the pixel size information from the image |
| Yaw (°) | The counter-clockwise angle of the object main axis on the x-y plane (around the z+ axis). Equal to 0 when aligned with the positive x axis. See https://en.wikipedia.org/wiki/Ship_motions |
Use case
- Download these images of fluorescent cells.
- Open the image_1.tif.
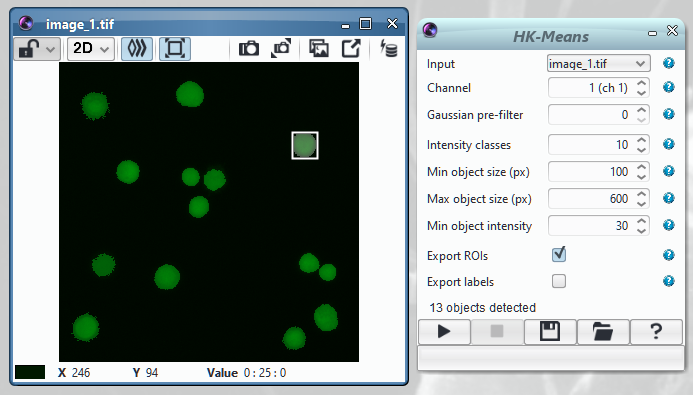
- Do a quick segmentation with the plugin HK-Means
- search for HK-Means in the search bar
- select the channel 1
- set the max object size to 600
- set the min object intensity to 30
- leave other parameters to default value

- Click on the wheel to select descriptors of choice, for instance, Area, Color, Icon, Mean intensity and Name. Click on “Columns to display” to reorder the descriptors by alphabetical order. Use the arrows to move up and down a descriptor in the list (it will change its position in the columns).
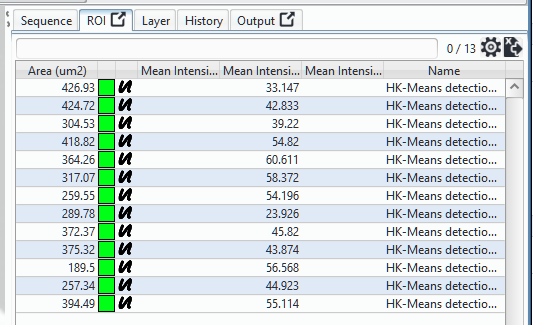
Note that here the Mean intensity measure is present three times because there is 3 channels but used only once because the segmentation was done on the channel 1.
To go further, notably on the use of ROI Statistics in protocol blocks, you can explore the protocol associated to these images. The block ROI Statistics (renamed “Compute statistics” is associated to the block Workbook to file to export the results to a spreadsheet). This protocol works in batch on a folder of images.
6 reviews on “ROI Statistics”