Short Description
Ensemble of blocks that implement SODA method for confocal and super-resolution microscopy, in 2 and 3 dimensions
Documentation
This plugin contains 4 functional and independent blocks that performs SODA analysis in standard (widefield, confocal, structured-illumination…) and localization-based (STORM, PALM, DNA-PAINT…) microscopy. These blocks are called SODA, SODA storm 2D, SODA storm 3D and SODA suite. They are documented below.
Details of the method and algorithm are given in Mapping molecular assemblies with fluorescence microscopy and object-based spatial statistics (2018), Nature Communications. Please cite this article when using the SODA plugin.
Webinars about SODA
Advanced SMLM colocalization webinar from the NEUBIAS Academy (English). Part 2 by Thibault Lagache (at 00:47:39) is on Statistical tools for analyzing the spatial distribution of objects with a demo on the SODA plugin.
Colocalisation analysis with the Icy plugin SODA, webinar from the RT MFM network (French), with explanations on the SODA plugin
Block SODA for Icy Protocols

Parameters of the block SODA
List of detections 1 & 2: spots (ROIs) corresponding to detections from channel or sequence 1 & 2
Input sequences: respective sequences of detections 1 & 2. Input sequences are used to compute the intensity centers (i.e. positions) of detections 1 & 2
ROI of analysis (cell’s shape) This key parameter corresponds to the ROI where SODA analysis is performed. If this ROI is too large, detections might appear as coupled (colocalized) while they are not..
Max. Radius and Step Max distance and step for computing the Ripley’s K function (see original article for details)
Fixed search distance: If selected, the plugin will simply count the number of detections 2 at distances 0, step,..,i*step,..Max. radius from detections 1
Output of the block SODA
The block SODA outputs a spreadsheet with the following values:
| Sequence Name | name of the processed image |
| Time | time frame number |
| Nb detections 1 | total number of detections 1 inside the selected ROIs of the image |
| Nb detections 2 | total number of detections 2 inside the selected ROIs of the image |
| r 1 | minimum distance used to compute the Ripley’s K function |
| r max | maximum distance (max radius) used to compute the Ripley’s K function |
| Maximum of the K function | max. value of the (reduced) Ripley’s K function over the different rings. It is used to compute the p-value of the null hypothesis (Poisson random distribution of detections 2) |
| p value log_10(p value) | As the p-value is usually very small (<10^-10..), the log_10(p_value) is computed (otherwise, the p-value would be « equal » to 0 due to numerical approximations) |
| nb single 1 | total number of spots in group 1 such that the coupling probability with any spot in group 2 is equal to 0 |
| nb single 2 | total number of spots in group 2 such that the coupling probability with any spot in group 1 is equal to 0 |
| nb coupled 1 | total number of spots 1 that are coupled (proba_coupling>0) with at least one spot 2 |
| Mean number of partners 2 | =nb coupled 2/nb coupled 1 |
| nb coupled 2 | total number of spots 2 that are coupled (proba_coupling>0) with at least one spot 1 |
| Mean number of partners 1 | =nb coupled 1/nb coupled 2 |
| Mean coupling probability | mean probability for two spots (one from group 1 and one from group 2) to be spatially coupled |
| Coupling index 1 | sum_{x in spots 1, y in spots 2}(proba_coupling (x,y))/(total number of spots 1) The coupling index gives an estimation of the “overlap” or the “association strength” between the two groups of spots |
| Coupling index 2 | sum_{x in spots 2, y in spots 1}(proba_coupling (x,y))/(total number of spots 2) The coupling index gives an estimation of the “overlap” or the “association strength” between the two groups of spots |
| Mean Coupling distance (pixels) | mean distance between a spot from group 1 and a spot from group 2 that are coupled (ie spatially associated) |
Protocols examples using the block SODA
- Easy SODA 2 colours – 1 image protocol: protocol using SODA block, with an example image
- SODA 2 colours protocol analyzing the coupling between 2 populations of spots (a third channel is used to automatically determine the cell’s ROI) and associated demo video

- Complete protocol (3 colors) used in original publication and associated demo video

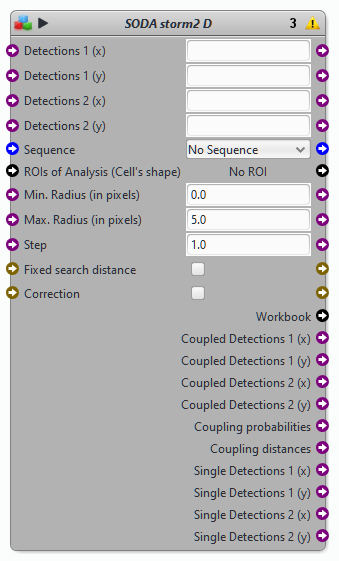
Block SODA STORM 2D
Protocols examples using the block SODA storm 2D
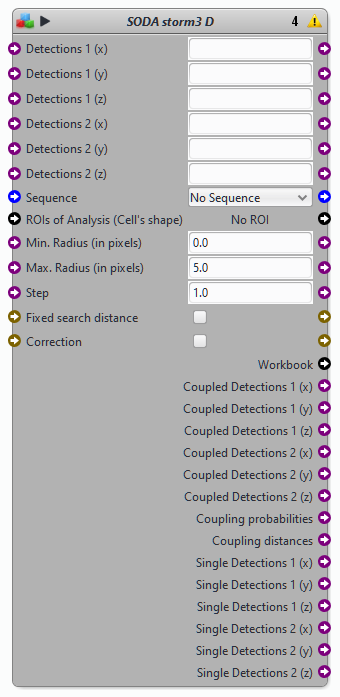
Blocks SODA STORM 3D
Protocols examples using the block SODA storm 3D
STORM 3D protocol and associated Demonstration video 1 (STORM imaging and analysis) and Demo video 2 (Using the SODA STORM 3D protocol)
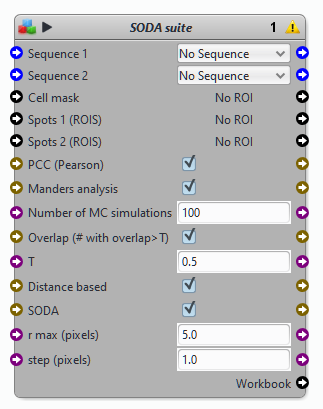
Block SODA suite